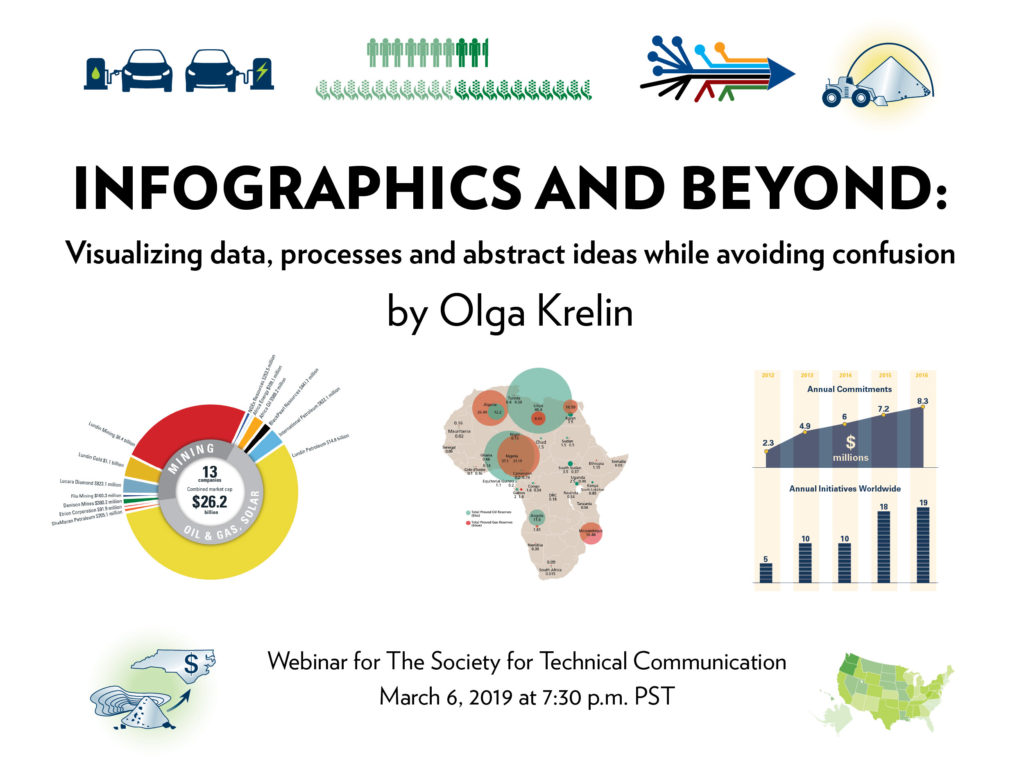
 Visual content should be an integral part of business communications. Most people are overloaded with written communications that they have no time to read. Research shows that most of the information transmitted to the brain is visual, and people process visuals much faster than text. After three days, visuals have 50% message retention, compared to bullet points at only 10%. High-quality visuals are flexible enough to be used across the full range of communications material, including press releases, reports, presentations, and social media.
In this webinar we will look at the content development process that leads to creation of visuals commonly referred to as infographics. We will cover:
- Different types of information visualization
- Selecting content appropriate for visualization
- Analyzing and grouping content that can be used to create infographics
- Visually communicating abstract concepts
- Avoiding confusion
About the presenter:
Olga Krelin is a graphic and industrial designer with over 20 years of international experience working with institutional and corporate clients. Over the last 14 years she has focused on technical communication, delving deeper into technical illustration and data visualization.
Olga is a co-founder of Mining Illustrated and a principal of Olga Krelin Design Associates, a boutique firm providing corporate clients with customized solutions to their communications and investor relations needs.
Registration
The webinar takes place via join.me on Wednesday, March 6, 2019 at 7:30 p.m. Pacific time. The event is free for STC members, $10 for non-members.
Please register by Tuesday, March 5, 2019:
You’ll receive login instructions by email, one hour before the start time.
